
The ImageEngine Control Panel provides Traffic information and analytics graphs to help you visualize how ImageEngine is performing on your site. These graphs are provided to help you keep track of your ImageEngine usage and keep an eye on any anomalies that can affect the performance of ImageEngine or your site.
In addition to per-engine and account analytics, we offer an Account Traffic Report to help you better understand the amount of traffic ImageEngine has served within a specific date range.
To ensure that you are getting the whole usage amount for a date range, please use the Account Traffic report.
Account Traffic Report
-
Click the bar chart icon to access the “Traffic Report” in the top-left of the sidebar.
-
The Usage report screen appears:
- Click "Generate" to produce the usage report for the prior month or specify a specific date range.
- The system displays the total data usage for each subscription and trial with your account in the grid.
- This information may be downloaded as text, CSV, or PDF by clicking the “Download” button.
Engine Analytics
On the Analytics page of your account, you can find helpful graphs to help see how ImageEngine works on your site.
To access the Analytics tab from the sidebar, you must first open the menu to the right of the subscription selection and click the "Analytics" option from the menu
You may view the analytics for all Engines or only a selected set. Uncheck boxes for engines you wish to leave out.
If you only wish to view the Analytics page for a specific engine, you may access a single Engine's analytics pages from the sidebar:
Graph descriptions
All graphs display the time frame that the graph displays. Use the CSV button to download the raw data used in the visualization.
Once you access the analytics tab, you will see the following graphs:
Cache Hit Ratio
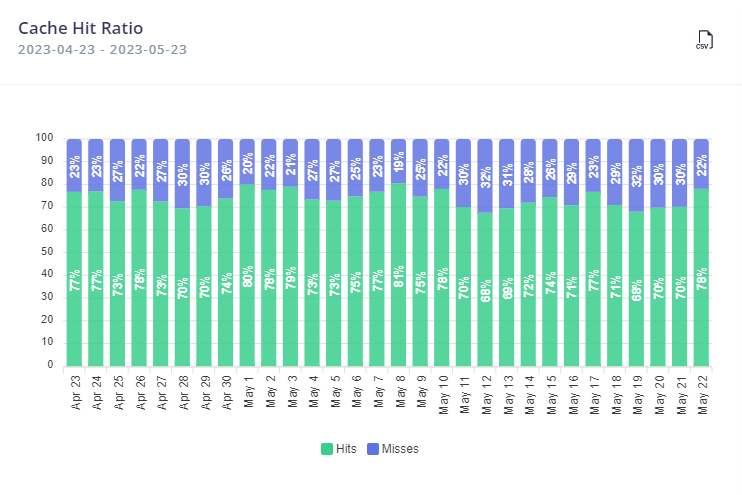
This graph shows the daily percentage of images served from ImageEngine servers (a cache hit) versus the amount served from the Origin (a cache miss).
A high amount of cache misses can mean many things, from low traffic, to new images being updated on the website. One option to consider if you wish to increase your cache hit rate is to increase the time to live (TTL) of images.
Image Payload Reduction
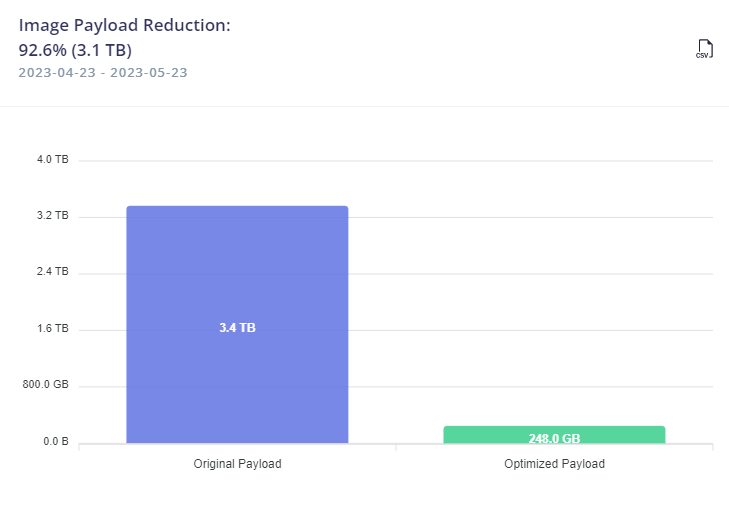
This graph presents a histogram of the Original bytes requested through ImageEngine, showing how much ImageEngine has reduced the payload of images. This is a helpful way to see how efficiently ImageEngine serves compressed images.
Daily payload saved
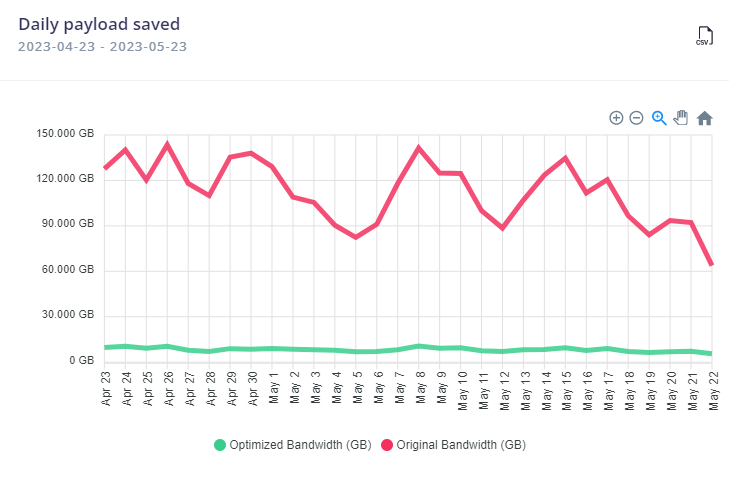
The Daily payload saved graph displays a timeline of outgoing optimized data (green line) compared to the initial size of the cached content (red line).
Requests
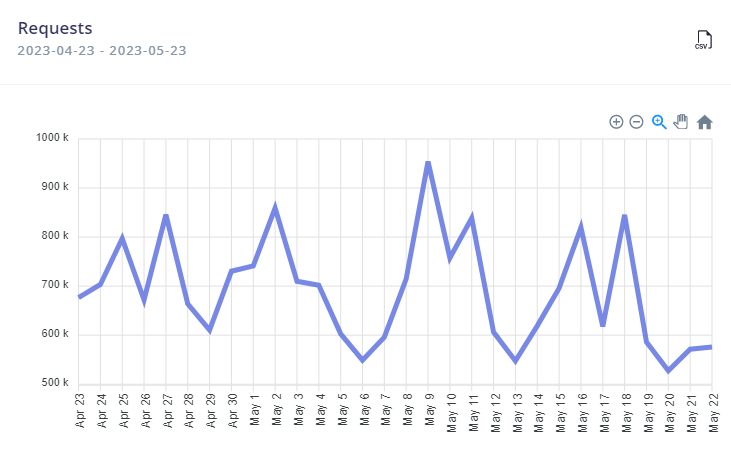
This is a timeline of the requests made to the selected Delivery Address(es).
Requests by GeoIP
Image vs Non-Image Traffic
Requests by GeoIP
This Graph displays the top countries accessing content through your configured Engines.
Bytes Saved By Image Format
View the aggregated original filesize of requested images vs. the filesize of the pictures optimized through ImageEngine. The information is presented according to the optimized file format.
If a jpg is optimized and is served as a Webp file, it is included in that column.
Requests By OS
Requests By Form Factor
Carbon Footprint Reduction
A website can have a bigger carbon footprint than you might think, and relatively easy actions can be taken to eliminate tonnes (literally) of CO2 emissions generated by your website. Reducing the image bytes transferred and stored while simultaneously maintaining the image's visual quality by using ImageEngine is one of these actions.
Read more about how the carbon footprint is calculated and how emissions are accounted for.
Billable Traffic
This Graph displays the total number of data used
Top Requested Images
Comments
0 comments
Please sign in to leave a comment.